Designed for Everyone
Whether you're just starting out in statistics or returning after a break, iNZight makes it easy. Pick your variables and the software handles the rest — choosing the right graph, the right summary, and the right test automatically. No steep learning curve, and nothing to re-learn.
Drag, Drop, Explore
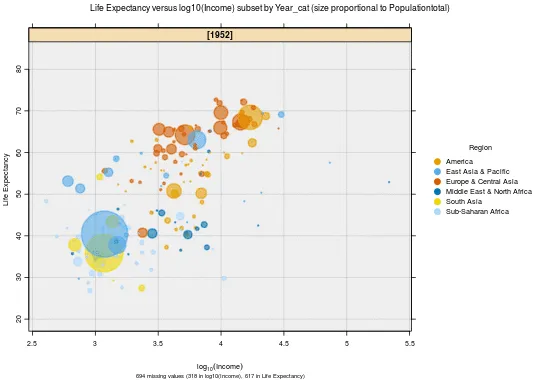
Interactive controls let you slice data, spot patterns, and generate publication-ready visualisations — all without writing a single line of code.
Powered by R
Built on R, one of the world's leading languages for data analysis and visualisation. Every analysis produces a reproducible R script you can view, edit, and share — start in the GUI and transition to code whenever you need full control.
Used by educators and researchers in Aotearoa and abroad

Ready to explore your data?
Download iNZight for Windows or jump straight into iNZight Lite in your browser — no installation needed.
New to iNZight? Start with the tutorial