Complex Survey Data
It is important that specialist methods be applied when analyzing data obtained using complex survey designs. Failure to do so typically leads biased estimates and incorrect standard errors, confidence intervals and p-values.
When a survey design has been defined almost all relevant parts of iNZight will apply analysis and graphics methods appropriate for data obtained using this survey design by applying functions in R's survey package.
Important difference for Get Summary. Whereas, generally, iNZight's Get Summary provides summary information about the dataset itself, when a survey design is specified Get Summary provides estimates of population quantities -- clearly labeled as such. (Raw summaries of survey data are often meaningless because of unequal probabilities of selection.)
Regular statistical software analyses data as if the data were collected using simple random sampling. Many surveys, however, are conducted using more complicated sampling methods. Not only is it often nearly impossible to implement simple random sampling, more complex methods are more efficient both financially and statistically. These methods use some or all of stratified sampling, cluster sampling and unequal sampling rates whereby some parts of a population are sampled more heavily (i.e. with higher probabilities of selection) than others parts. These sampling features have to be allowed for in the analysis. While sometimes it may be possible to get reasonably accurate results using non-survey software, there is no practical way to know beforehand how far wrong the results from non-survey software will be.
Survey designs are typically specified to analysis programs either by specifying a survey design in terms of weighting, strata and clustering variables etc in the data set, or by selecting a set of variables in the dataset containing so-called replicate weights. Post-stratification/raking/calibration facilitates using additional population information (external to the survey data) to improve survey estimates. This is done after a survey design has been specified (by either method).
To specify a survey design in iNZight, go to Dataset → Survey design and choose the appropriate option.
For an in-depth account, see "iNZight and Sample Surveys" by Richard Arnold
What is special about analysing survey data?
In almost all of the data analysis you have learned to do, the computer programs essentially assume that the observations you have come from a random sample from some process or infinite population Technically, for a random sample all observations are "independent and identically distributed", or in practice in the survey context:
-
all individuals have same probability of selection
-
individuals are selected independently of one another
-
Note: Sampling at random from a finite population with replacement meets these conditions but we don't sample that way in practice
Survey data
-
Survey data is typically obtained using more complicated random sampling schemes
-
that do not meet the technical requirements of "a random sample"
-
Survey samples typically use stratified sampling, cluster sampling, etc.
-
i.e., they use complex sampling designs
-
Units are sampled from finite populations without replacement
-
Different individuals may even have different probabilities of being sampled!
-
If you use standard programs for survey data all the answers you get can be grossly wrong
-
Wrong estimates, wrong standard errors, wrong confidence intervals, wrong p-values, ...
-
Special programs know how to do these things properly
-
But you have to tell the program how you obtained your data
Why not just do a simple random sample?
(e.g. get a list of all the people and draw a random sample without replacement)
-
After all it's a really simple idea -- so why does no one ever do it with face-to-face interview surveys?
-
The main reason is that it costs too much
-
No one could ever afford all the travel time and travel costs to deliver interviewers to the doors of the randomly selected houses
-
If we get someone to a location we want them to do as much of their work in the close vicinity of that location as possible
-
Ridiculous extreme: "sample" all new Zealanders by taking everyone from a few streets in one suburb of Auckland
-
Really cheap but completely useless, unrepresentative "sample of all NZers"
-
So we will need to find out about how to make sensible tradeoffs
What do Agencies (e.g. Stats NZ) want to estimate from their data?
- Mainly means, totals, proportions (percentages) and ratios
- For the whole survey population and also broken out by subgroups
What do medical and social science researchers want to estimate from their data?
As for Agencies and also things like ...
- regressions
- logistic regressions etc.
All that is new here is that we use special programs designed for survey data and the program needs to be told how the sampling was done. Apart from that it is pretty much business as usual
Simple random sampling (SRS)
What is it?
- Involves sampling without replacement
- all possible samples are equally likely to be chosen
- Thus, each unit/person in the population is selected with equal probability
- To take a simple random sample you need a list of all units in the population (sampling frame)
- Each observation unit is assigned a number and a sample is selected so that each unit has the same chance of occurring in the sample
- can be thought of as “drawing numbers from a hat”
Strengths
- Requires no information other than sampling frame
- e.g. no assumptions about the distribution of population values
- Reasonably efficient when we do not have much prior knowledge
- Widely accepted as being “fair”, unbiased
- Simple theory and analysis
- Can use standard software if sample size is less than about 10% of population size
- Otherwise may need “finite population corrections” (fpc)
- Can use standard software if sample size is less than about 10% of population size
Weaknesses
- Often expensive and time-consuming
- Makes no use of any additional information we might have about the population
- Sampling frame may be difficult to obtain
- requires an accurate list of the whole population which may be impossible to get
- Very sensitive to non-response and other non-sampling errors
Elements of most survey sampling designs used in practice
- Sampling without replacement
- Complex sampling, some or all of:
- Stratified sampling
- Cluster sampling
- +-Unequal probabilities of selection
Sampling without replacement from a finite population
Why do it?
- Drawing a unit out of a hat, measuring it, putting it back in the hat, and then measuring it again on some subsequent draw seldom makes any practical sense
What are the consequences of ignoring sampling without replacement in the analysis?
- The usual standard errors of estimates of characteristics of the finite population are too big if the sample size n makes up a substantial fraction of the population size
- Roughly, Actual standard error of an estimate is approximately (Usual std error ) .
Stratified sampling
What is it?
- Divide the population into non-overlapping groups, called: strata (singular=stratum)
- so that each unit belongs to one, and only one, of the strata (groups)
- Take a sample of units from within each/every stratum (group)
- (e.g. the strata could correspond to geographical regions, or to age groups)
- Note: Stratified sampling tends to subdivide the population into a relatively small number of groups (then called strata), whereas cluster sampling tends to involve a larger number of groups (then called clusters). They differ in how we then use these groups when we draw samples.
- If we are thinking in terms of strata, it is because we plan only to collect data from every one of the groups.
Why do stratified sampling?
- We can use it to increase the precision of estimates (i.e. reduce their standard errors)
- We may have a way of defining strata so that individuals within the same stratum tend to more similar (homogeneous) and those from different strata are more different (heterogeneous). (e.g. if we are interested in incomes in Auckland, stratifying on suburb would tend to do this) In this case, sensible stratified sampling leads to more precise estimates of quantities relating to the whole population than a simple random sample (i.e. estimates which have smaller standard errors, giving narrower confidence intervals …)
- It can provide some protection against bad (unlucky) samples
- We can ensure that the sample proportions in groups we particularly care about are the same as the population proportions (e.g. sample 50 males and 50 females. If we randomly sampled 100 people the sample proportions of males and females we got could be quite far from 50-50)
- We may want to report at the level of the strata (e.g. report the mean income for each region) and want to control how much data is collected in each stratum
- e.g. if we want to report incomes for Maori, Pacifica, European, Asian and Other we may want to sample the same numbers of people from each group so that all of these estimates have similar accuracies.
- It allows us to use different sampling methods in each stratum
- (e.g. telephone in rural areas and face-to-face interviews in cities)
- Interviewers can be trained to deal well with a particular stratum
- It often makes good practical sense to include more of “the big important units”
- (e.g. take all of the very large companies, sample 30% of the midsize companies and 5% of small companies)
What are the consequences of ignoring stratified sampling in the analysis?
- Standard errors reported from standard (non-survey) programs tend to be too big
- Estimates relating to the whole population from standard programs are often wrong
- They tend to be wrong unless the proportions of the total sample size allotted to each stratum closely approximate the corresponding proportions of the population that belong to that stratum
- i.e. unless each is approximately equal to , (“proportional allocation”)
- Here is the number sampled in stratum , , and is the population number in stratum . (The population size is .)
- i.e. unless each is approximately equal to , (“proportional allocation”)
- They tend to be wrong unless the proportions of the total sample size allotted to each stratum closely approximate the corresponding proportions of the population that belong to that stratum
Cluster sampling
What is it?
- Think in terms of all units in the entire population being subdivided into non overlapping groups called clusters, usually on the basis of physical proximity (close together)
- (e.g. if units are households we could treat all houses in the same street as forming a cluster, or all pupils in the same school could be a cluster)
- A cluster sample would select a sample of clusters from a list of all of the clusters and then select all of the units from the selected clusters
- (e.g. sample streets from a list of streets and then take all houses in the sampled streets)
- Multistage cluster sampling employs the clustering idea at several levels
- (e.g. sample schools from a list of schools and, for each selected school, sample classes from the list of classes in that school and then either take all or a sample of students from each of the selected classes. OR select towns, then census blocks within towns, then households within census blocks and then, finally, people within households)
- Note: Cluster sampling tends to employ a relatively large number of groups (then called clusters) whereas stratified sampling tends to involve a small number of groups (then called strata). They differ in how we then use these groups in our sampling plan. If we are thinking in terms of strata, it is because we plan to collect data from each and every group.
- (e.g. sample schools from a list of schools and, for each selected school, sample classes from the list of classes in that school and then either take all or a sample of students from each of the selected classes. OR select towns, then census blocks within towns, then households within census blocks and then, finally, people within households)
If we are thinking in terms of clusters, it is because we plan only to collect data just from a sampled subset of the groups.
Why do cluster sampling?
- It can be much cheaper than simple random sampling
- Units in a cluster are closer together (e.g. reducing travelling time)
- We can obtain information from a single source (which also reduces costs)
- So we can often get more accuracy for the same cost (or the same accuracy for a reduced cost)
- We don’t need a complete sampling frame of all individuals in the population, only lists of clusters and then lists of units (or sub-clusters) for the selected clusters only
- If we want to do interventions, we can often only apply them at the level of the cluster
- E.g. use different teaching methods on different classes
What are the consequences of ignoring cluster sampling?
- Cluster sampling generally leads to
- positive correlations between units in the same cluster
- An effective sample size which is smaller than the total number of units observed
- We have “less information” than we would from a simple random sample with the same number of units in it
- The effective sample size can be closer to the number of clusters sampled than to the number of units finally obtained
- Design effects (actually 1/ d.eff) give indications of efficiency loss (described in later Lectures)
- Standard errors reported from standard (non-survey) programs tend to be too small
- Coverage of 95% confidence intervals cover
- Estimates from standard programs relating to the whole population are often wrong
One-stage versus multistage cluster sampling
-
simple or one-stage cluster sample select a sample of clusters from a list of all of the clusters and then select all of the units from the selected clusters
- e.g. sample streets from a list of streets and then take all houses in the sampled streets
-
Multistage cluster sampling
-
simple or one-stage cluster sample select a sample of clusters from a list of all of the clusters and then select all of the units from the selected clusters
- e.g. sample streets from a list of streets and then take all houses in the sampled streets
-
Multistage cluster sampling
- employs the clustering idea at several levels
- e.g. sample schools from a list of schools and, for each selected school, sample classes from the list of classes in that school and then either take all or a sample of students from each of the selected classes
- The 1st stage of clustering is the first level at which sampling occurs (schools in the Example)
- The 2nd stage of clustering is the 2nd level at which sampling occurs (classes in the Example)
- and so on
- employs the clustering idea at several levels
-
Primary Sampling Units (psu)
- The psu’s are the entities selected at the first level at which sampling is performed
- If no cluster sampling involved (srs or stratified sampling alone)
- the psu is the unit/person selected into the sample
- If no cluster sampling involved (srs or stratified sampling alone)
- Where cluster sampling is involved:
- the psu are the entities selected at the 1st stage of sampling
- e.g. If we sample schools, then classes within schools and then, finally, students within classes, then the psu’s are the schools
- the psu are the entities selected at the 1st stage of sampling
- Practical aside
- To make corrections that are adequate for most purposes, computer programs only need to know about the first stage of cluster sampling. (As of SAS 9.1, it only asks for and uses the first stage information)
Complex sampling
It is very common for a sample survey’s selection protocol to include elements of both stratified sampling and cluster sampling
- In particularly common for cluster samples to be taken from within every stratum of the population
- e.g. we could take a cluster sample of schools from every region of the country (here regions are the strata and schools are the clusters)
What is the most important new skill to be learned for analysing survey data?
The biggest difference between analysing survey data and the data analysis you have already seen is that for survey data, you have to tell the program how the data was collected
- Was stratified sampling used? If so, what were the strata?
- Was cluster sampling used? If so, what were the clusters?
- What were the selection probabilities?
- most programs want “sampling weights” which are the inverse (1 over) probabilities of selection
Asides about “precision” and “accuracy” of estimates
- The “precision” of an estimate
- relates to how variable estimates of this type would be if we repeatedly kept taking samples
- It’s an idea we try to capture using the standard error as our measure
- Smaller std error = more precise estimate.
- larger std error = less precise estimate.In most survey applications, a confidence interval is approx.
- CI for true value: estimate ± 2×se
so higher precision translates into narrower confidence interval
- The “accuracy” of an estimate
- incorporates any bias as well as the sampling variability
- It’s an idea we try to capture using the Mean Squared Error (MSE) as our measure
- High accuracy translates to low Mean Squared Error
Provided our data collection is perfect, most of our estimates are unbiased (i.e. have bias=0) or almost unbiased so the two ideas come together
- Remember back to “normal statistics”
- Our measure of precision for a sample mean was
- Our measure of precision for a sample proportion was
- As the sample size increases our estimates tend to get more precise scaling as
- e.g., to double the precision (i.e. halve the std error) we need to take 4 times as large a sample, etc
- In general, we get greater precision (smaller std errors, narrower CIs) if we take larger samples.
- Standard errors tend to decrease roughly proportionately to
- (if we are talking about the standard error of an estimate that relates only to a subgroup, e.g. the mean income for Europeans, then the relevant “sample size” is the sample size for that subgroup)
Unequal probabilities of selection
Example: Tables from the 2006 NZ Census show nearly 5 times as many people of European ethnicity as of Maori ethnicity. Suppose that a survey sampled 500 Europeans and 500 Maori. Any individual Maori would be 5 times as likely to be selected into the sample as any individual European.
- It common in surveys, for units in the population to be selected for the sample with different probabilities
- It is particularly common for units in different strata to be sampled at different rates (cf. Maori and European above)
- It is critically important, however, that no unit in the population has a zero probability of being selected
Why use unequal probabilities of selection?
- Often used in the context of stratified sampling
- Particularly if reporting is also to be done at the level of the strata themselves, as well as for the whole population, likely to want to ensure large enough sample sizes in each stratum to ensure sufficiently precise stratum-level estimates (e.g. income levels accurately estimated for each of the ethnicity)
- Thus units in small strata will have higher probabilities of selection than units in large strata
- e.g. take equal numbers of Maori, Pacifica and Other
- Thus units in small strata will have higher probabilities of selection than units in large strata
- Often makes good practical sense to include more of “the big important units”
- e.g. economic surveys often survey all of the very big companies
- Particularly if reporting is also to be done at the level of the strata themselves, as well as for the whole population, likely to want to ensure large enough sample sizes in each stratum to ensure sufficiently precise stratum-level estimates (e.g. income levels accurately estimated for each of the ethnicity)
- Can sometimes increases precision of estimates
What goes wrong if we ignore it?
- If, when doing the analysis, we ignore the fact that the data has been sampled using unequal probabilities of selection we can get the wrong answers for almost everything
- If the probabilities of selection are not all the same, then we have to give the program:
- either the selection probabilities
- or, “the weights” = 1/selection probabilities -- this is what we’ll usually be doing
- The basic idea of weighting is that, “the weight to be assigned for a unit in the sample is the number of units in the population that the sampled unit represents”
- e.g. if we select people at random from stratum which has people in it, then each of the 100 people selected “represents” 10 people
- more generally, each of the one of the people selected represents people
- e.g. if we select people at random from stratum which has people in it, then each of the 100 people selected “represents” 10 people
- or, we can supply other information from which the program can work these things out
- e.g. we might give the program the numbers of people in the population in each stratum
- The basic idea of weighting is that, “the weight to be assigned for a unit in the sample is the number of units in the population that the sampled unit represents”
Reminder: What is the most important new skill to be learned for analysing survey data?
The biggest difference between analysing survey data and the data analysis you have already seen is that for survey data, you have to tell the program how the data was collected
- Was stratified sampling used? If so, what were the strata?
- Was cluster sampling used? If so, what were the clusters?
- What were the selection probabilities? (many programs want “weights” which are 1 over the probability of selection)
- Should we be making finite population corrections? (see later)
Being able to identify these structures from descriptions of surveys is one of the most important skills to acquire and take away from this course.
- It is also very important to be able to describe the sampling structures to software. This second skill is a much easier skill to learn, however.
Recognising these sampling structures is absolutely critical. If you cannot do that, then you cannot even get started on doing valid data analysis.
Descriptive versus Analytic studies
Government Agencies, pollsters (and some others) are most often interested in “What was it like?”
-
We call studies addressing this “descriptive” studies
-
They want to summarise the way it was in a particular population during a particular time span
- And present estimates such quantities as population means, totals, counts, proportions, ratios
- often broken out by region, age, sex, calendar year, …
- And present estimates such quantities as population means, totals, counts, proportions, ratios
-
These are real, finite populations
- If we had data from a complete census (rather than sampling) we would just calculate these summaries and there would be no uncertainty
- So no need for standard errors, confidence intervals etc. We’d know exactly what the population summary values were
- But usually we sample. The uncertainty is caused by the randomness in the selection of who gets into the sample that we use to calculate our estimates
- Our confidence intervals are interval estimates of the quantity that we would have obtained if we’d been able to calculate the summary for the whole finite population
- No other area of statistics really cares about these types of inference
- If we had data from a complete census (rather than sampling) we would just calculate these summaries and there would be no uncertainty
-
Many researchers are most interested in “How does it work?”, or “Why is it like that”? or Predicting what will happen if we did it again or in the future
- We call these studies with these aims, “analytic”
- We are interested in the nature of relationships between variables, in differences, regressions, … – all the standard STATS 20x stuff and beyond
- If we had data on a whole finite population we would analyse the data thinking in terms of the population itself having been generated by some random process and we would be interested in patterns in the way this random data was generated
- Even with complete data from the whole finite population, there would still be uncertainty
- We call these studies with these aims, “analytic”
-
Analysis needs to allow for uncertainties in the random process that generated the finite population data plus additional uncertainties generated by sampling from that finite population
-
So with analytic studies …
- Even with complete data from the whole finite population, there would still be uncertainty
- Analysis needs to allow for uncertainties in the random process that generated the finite population data plus additional uncertainties generated by sampling from that finite population
- We can do all of the STATS 20x analyses, the linear and logistic regressions …
- All that is new here is that we use special programs designed for survey data and the program needs to be told how the sampling was done
- Apart from that it is pretty much business as usual
Sampling without replacement from a finite population
Why do it?
- Drawing a unit out of a hat, measuring it, putting it back in the hat, and then measuring it again on some subsequent draw seldom makes any practical sense
What are the consequences of ignoring sampling without replacement in the analysis?
- The usual standard errors of estimates of characteristics of the finite population are too big if the sample size n makes up a substantial fraction of the population size
- To compensate we use co-called finite population corrections (fpc)
- Roughly, actual std error of an estimate = Usual std error
- where , is the so-called “sampling fraction” (= sample size/popn size)
When do we use finite population corrections (fpcs)
- Generally, we use finite population corrections for descriptive studies
- (interested in describing the way the population is)
- but not analytic studies
- (interested in the processes that produced a population like that)
- We will address the issues around fpc's in more detail in a later Lecture
- including why the standard errors under sampling from a finite population should be smaller than the standard ones
Specifying Survey Designs in iNZight
iNZight lets users specify complex survey designs in several ways. Under the hood, iNZight uses the survey R package.
The first is to manually specify information about the design, such as the strata, clusters, and weights, or by specifying replicate weights. While this is the simplest method, it does come with the risk of misspecification.
An alternative method is to use a survey specification file. This allows users to set up a survey with one-click (either by importing the file directly, or loading the survey design information from it). If you are distributing a survey to use with iNZight, unless you are teaching a course about survey design and the design specification is an integral part, we recommend you distribute the data with a survey specification file.
Specify Design Information
Specifying a survey design in terms of weighting, strata and clustering variables etc.
iNZight's survey methods cater for simple random sampling, stratified random sampling (random sampling within each population stratum), cluster sampling and multistage cluster sampling, and complex designs involving cluster sampling within population strata.
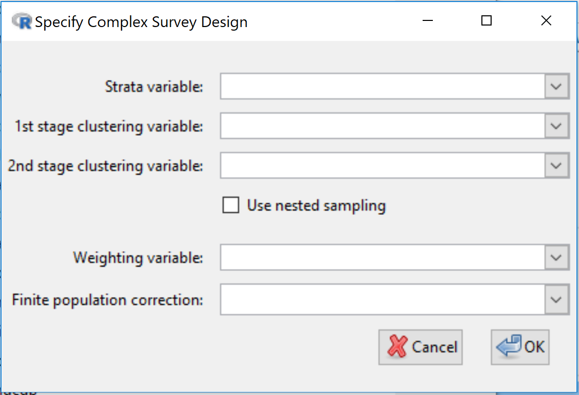
To specify the design, go to Dataset > Survey design > Specify design ....
-
Strata variable: If stratified sampling has been performed, use to select the variable that specifies which stratum each observation comes from. (This variable can be either numeric or categorical.)
-
1st stage clustering variable: If cluster sampling has been performed, use to select the 1st-stage clustering variable; this specifies which 1st-stage cluster each observation comes from. (Clustering variables can also be either numeric or categorical.)
-
2nd stage clustering variable: If two or more stages of cluster sampling have been performed, use to select the 2nd-stage clustering variable (specifies which 2nd-stage cluster each observation comes from). Any further levels of cluster sampling (3rd stage, etc., are not used)
-
Use nested sampling: Quite often, compilers of survey data "reuse" cluster names from stratum to stratum. Let us take, as an example, a survey in which American states for the starts and counties form the clusters. Sampled counties from Washington State may be given a County value of 1, 2, ... and counties from Arizona may also be given a County value of 1, 2, ... Clearly County 1 from Washington refers to an entirely different county from County 1 from Arizona even though they have the same value of the County variable.
Click the Use nested sampling check-box if cluster labels are being recycled/reused in the data.
-
Weighting variable: If the sampling design used unequal probabilities of selection, use this to select a variable containing the sampling weight (1 over the probability of selection) for each observation. Certain estimates will be wrong if the sampling weights do not add up to the population size, in particular estimated population or subpopulation totals and estimated population or subpopulation sizes. Sampling weights are often adjusted to allow for unit non-response.
-
Finite population correction (fpc): Use this when descriptive inferences are wanted about properties of the finite population being sampled and the sample size is an appreciable proportion of the population size (e.g. > 5 or 10%). If stratified sampling has not been used, this variable should contain an estimate of the size of the population being sampled, repeated for every observation. If stratified sampling has been used, the values of this variable should contain an estimate of the size of the population stratum being sampled (differing across strata but constant within each stratum).
As an alternative to using population/stratum sizes, proportions of the total population being sampled can be used.
If one stage cluster sampling has been used (where we take a random sample of clusters, and a census within clusters), the finite-population-correction selection-box should contain an estimate of the total number of clusters (the same on every row, or the same on every row within a stratum).
In two stage clustering we subsample within each selected cluster, and so we need to specify two variables: one for the number of clusters (just as in one stage clustering), and a second for the total number of units available for selection within each cluster (the same value on every row within the cluster). If the number of clusters is stored in a variable called fpc1, and the number of units within a cluster is stored in a variable called fpc2, then type/paste __fpc1+fpc2__ in the finite population correction field.
For more information on quantities referred to in the dialog box see the documentation of the svydesign function in R's survey package.
Specifying Replicate Design Information
Because making public factors like cluster membership can make it easier than survey agencies are comfortable with to identify individuals, many agencies do not distribute such information to outsiders. Instead they distribute sets of so-called replicate weights, slightly varying copies of the sampling weights variable that still enable survey analysis programs to make the proper adjustments to analyses of survey data.
Left-hand panel
-
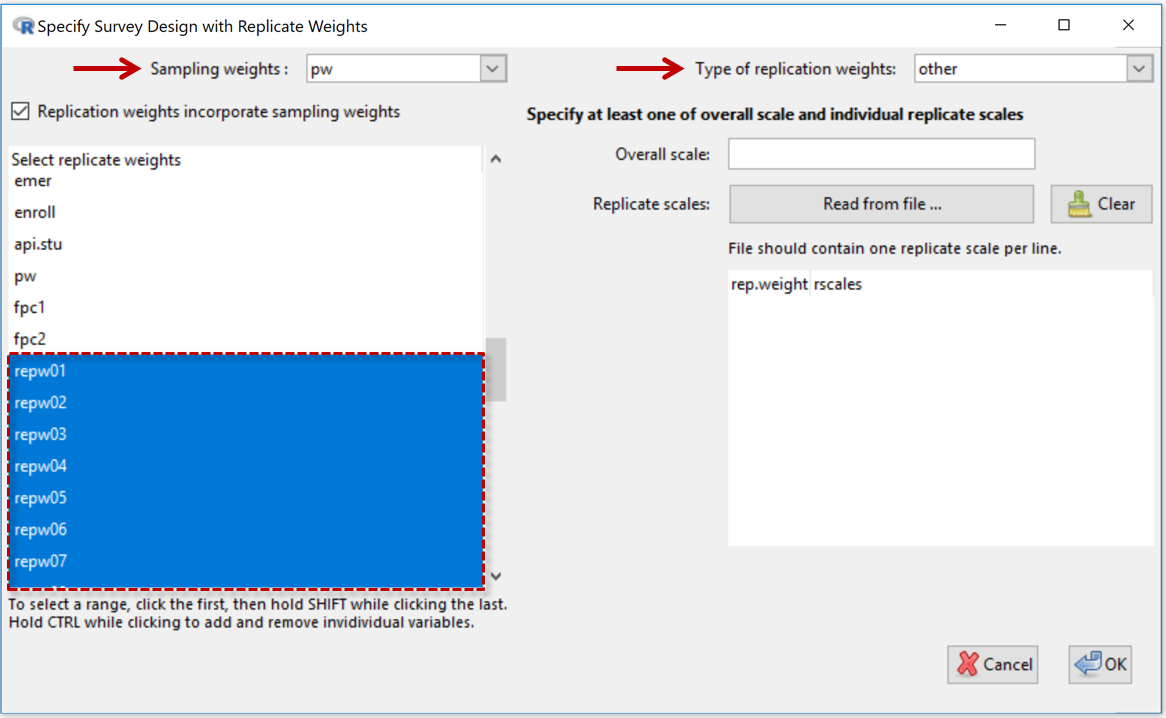
Sampling Weights: See variable selection box at the top-left
-
Replication weights incorporate sampling weights (checkbox): This should be checked if the replicate weights already include the sampling weights (which is usually the case). Uncheck this if the replicate weights are very different in size to the sampling weights.
-
Select replicate weights: The large (lower) panel on the left-hand side displays the names of the variables in the dataset. Use to select the replicate-weights variables. In the example shown the replicate-weights variables were called repw01, repw02, repw03, ...
Right-hand panel
-
Type of replication weights: Depends on the type of replicate weights the person who compiled the dataset has used. Select from list - BRR, Fay, JK1, JKn, bootstrap, other.
-
Overall scales: Only used for Types bootstrap and other.
For more information on quantities referred to above
- see the documentation for the svrepdesign function in R's survey package and also here
- see also the section on replicate weights in "iNZight and Sample Surveys" by Richard Arnold.
Calibrating Survey Data
This allows for poststratifying/raking/calibrating a design that has already been defined using either of the methods above above.
This allows a data-analyst to improve estimation by augmenting the information in the survey data by adding information on the whole population where this is available from other sources. Categorical variables in the data set are offered as possible poststratification/raking/calibration candidates. Corresponding population counts can be input by typing or reading from files.
To calibrate a survey, go to Dataset > Survey design > Post stratify....
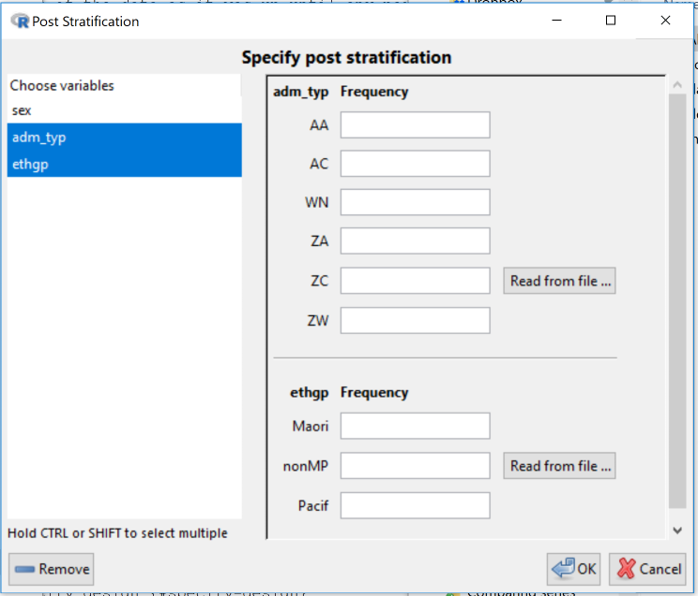
In the example in the screenshot, there are 3 categorical variables in the data set offered as possible candidates and 2 have been selected. The design would then be calibrated using user-supplied information on population counts for the all the categories of both admin_type and ethgp.
This is fine when you only want to use information about single variables, but what if you have population information on the cross-classification (all possible combinations) of admin_type and ethgp, say? Then you would have to create a new variable in the dataset, called say admin_type.ethgp that has all these combinations. This can be done with Variables > Categorical Variables > Combine categorical variables.
Currently the new variables have to be set up before specifying a survey design. If you only think about it later you will need to use Remove design (next item), set up new variables and then re-specify the design.
The design is updated using the calibrate function in R's survey package.
For more information on quantities referred to in the dialog box see here.
Remove Design Information
Discard design information and revert to using standard methods of analysis by going to Dataset > Survey design > Remove design.