Inference
The Add Inference Information button allows you to quickly add inferential markup to the current plot. The type of inference displayed depends on the type of plot and the selected parameter.
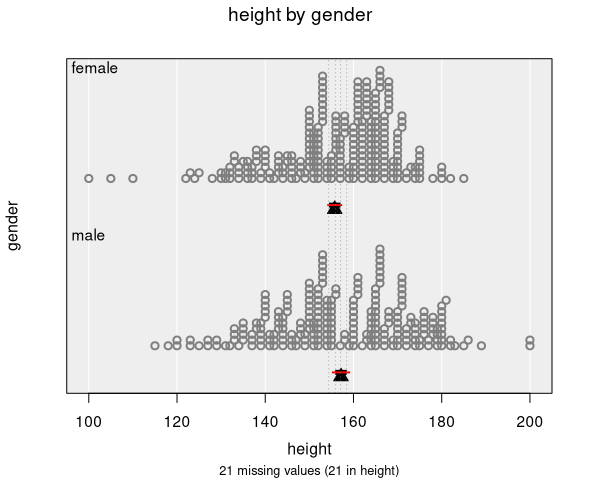
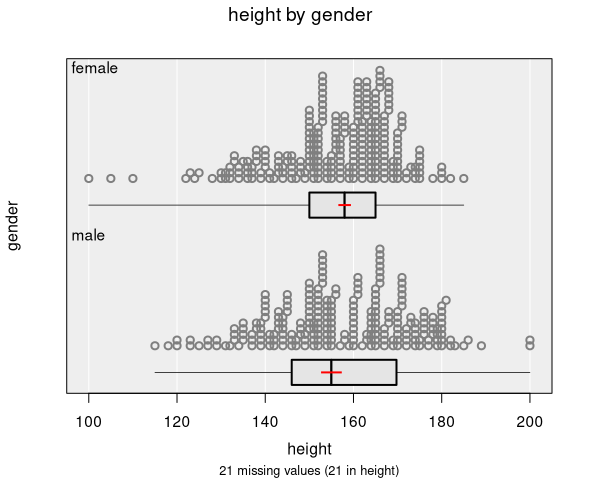
Dot plots and histograms
For dot plots and histograms (one numeric variable, optionally grouped by a categorical variable), inference displays confidence and comparison intervals for a chosen summary statistic.
Parameters
- Mean (default): Shows the sample mean with confidence and comparison intervals
- Median: Available with bootstrap inference — shows the median with bootstrap confidence intervals, along with intervals for the interquartile range
Interval types
- Confidence intervals (red by default): Show the range of plausible values for the parameter. A 95% confidence interval means that, if we repeated the study many times, about 95% of such intervals would contain the true population value.
- Comparison intervals (black by default): Designed for visual comparisons between groups. If the comparison intervals of two groups do not overlap, there is evidence of a statistically significant difference between them.
Grouped data
When the data are grouped by a categorical variable (e.g., height by gender):
- Separate intervals are shown for each group
- The numeric summary includes:
- Group means/medians with confidence intervals
- Difference in group means with a confidence interval
- A two-sample t-test (for two groups) or ANOVA F-test (for three or more groups)
- Multiple comparisons with adjusted p-values (for three or more groups)
Bootstrap inference
Selecting bootstrap inference uses nonparametric bootstrap simulation (1500 resamples by default) instead of formula-based intervals. This provides:
- Bootstrap confidence intervals for the mean
- Bootstrap confidence intervals for the median
- Bootstrap confidence intervals for the interquartile range
- Visual bootstrap samples shown as dotted lines on the plot
Bootstrap inference makes fewer assumptions about the distribution of the data and is recommended when the sample size is small or the data are heavily skewed.
Bar charts
For bar charts (one or two categorical variables), inference focuses on proportions.
One-way bar charts
- Displays estimated proportions for each category with confidence intervals
- The numeric summary includes:
- Proportion estimates with confidence intervals
- Pairwise differences in proportions with adjusted confidence intervals
- A chi-square test for equal proportions (or a simulated p-value if expected counts are small)
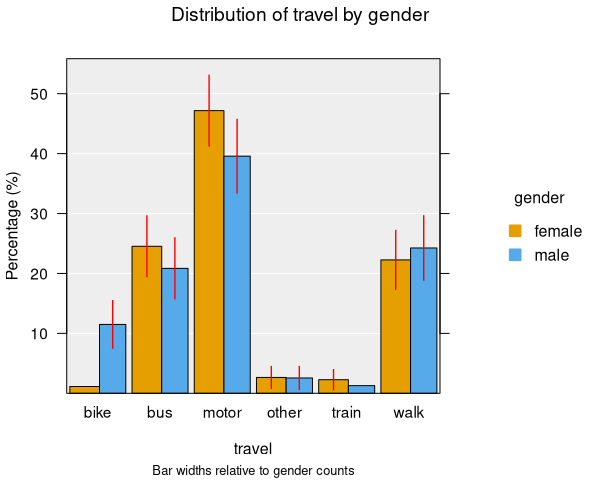
Two-way bar charts
- Displays estimated proportions within each group
- The numeric summary includes:
- Estimated proportion table with confidence intervals
- Pairwise differences in proportions for each level
- A chi-square test for independence (testing whether the distribution of one variable depends on the other)
Inference is only displayed for categories with at least 5 observations by default. Categories with fewer observations are excluded from inference calculations.
Inference is not available when the bar chart is displaying counts instead of proportions. Switch to proportion mode to see inference information.
Scatter plots
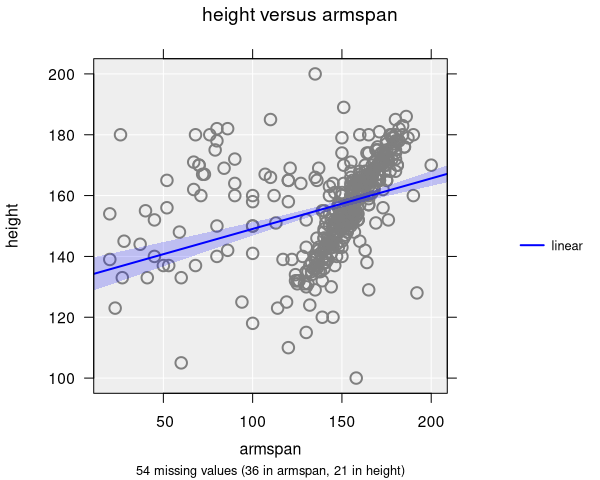
For scatter plots (two numeric variables), inference is shown alongside trend lines. You must add at least one trend line to see inference information.
What is shown
- Confidence bands: Shaded regions around trend lines showing the uncertainty of the fitted relationship
- Bootstrap trend lines: When bootstrap inference is selected, multiple dotted lines are drawn showing the variability of the fitted relationship across bootstrap samples
Numeric summary
The numeric summary for scatter plots with trend lines includes:
- Regression coefficients (intercept and slope terms) with confidence intervals and p-values
- For quadratic and cubic trends, higher-order coefficients are also shown
- Correlation coefficient (with bootstrap inference)
- P-values test the null hypothesis that each coefficient is zero (no association)
Hexagonal binning and grid density plots
Inference for hexagonal binning and grid density plots works the same as for scatter plots — trend lines and smoothers can be added, and confidence bands and bootstrap lines are displayed in the same way.
Confidence level
The default confidence level is 95% but can be adjusted. This affects both the width of confidence intervals on the plot and the intervals reported in the numeric summary.