Explore the Interface
The iNZight GUI, shown below, can be divided into several different sections. In this section, we will go over each describing its importance.
While using iNZight, if you come across something you are unsure about, you can use the following pages to track down the relevant documentation. Note in many cases iNZight includes a help button which will take you directly to the relevant page.
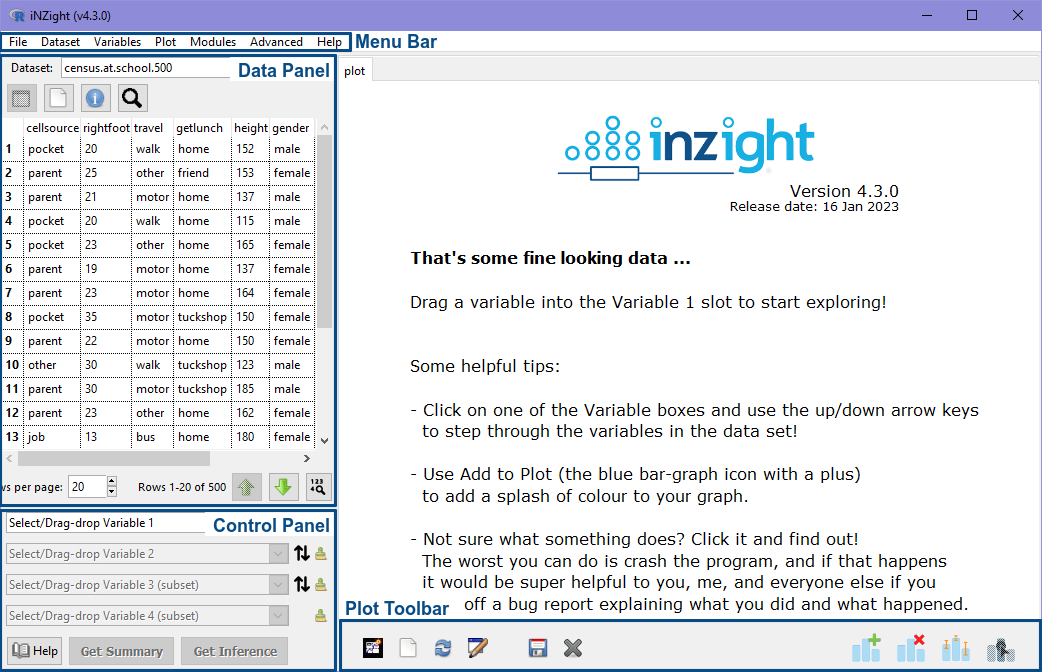
📄️ The Menu Bar
The menubar at the top of the window is where you interact with data and variables.
📄️ The Data Panel
The data panel is where users can switch between various datasets, view the spreadsheet or variables, and search for variables.
📄️ Control Panel
The main iNZight control panel for selecting variables.
📄️ Plot Toolbar
The Plot Toolbar is a collection of buttons that allow you to interact with the plot.