The Data Panel
Situated in the top-left quadrant of the interface, the data panel primarily displays the active data, either as a spreadsheet or a list of variables. Above this are several buttons for switching between views, viewing information about the dataset, and searching for variables. The dropdown at the top lets users switch between documents (both imported and created by actions from the Dataset menu).
Dataset selection box

As you explore your dataset, you may experiment with actions from the dataset menu. Most of these actions perform large-scale changes on your data, which may not always go as planned. iNZight creates a new dataset each time, and appends a suffix to the dataset's name. The dataset selection box provides a list of all the datasets created so far, and allows users to switch between them.
Dataset toolbar

Below the dataset selection box is a row of buttons. The two left-most of these allow users to switch between spreadsheet and variable view. The third button opens a new window with a general overview summary of the dataset, and the fourth button opens a search box.
| Icon | Name | Description |
|---|---|---|
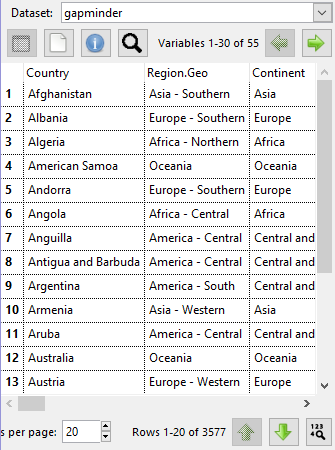
 | Spreadsheet View | Clicking this button will display the dataset in full (though paginated for performance reasons). This lets users see each individual value in their dataset, and is the default view. The columns of the spreadsheet view are draggable. By clicking and dragging the names onto the [variable selection boxes], users can quickly explore their data visually — the graphs will automatically appear on the right of the iNZight interface. The spreadsheet view also provides minimal capabilties for data editing. By double-clicking on a cell, it is possible for individual values to be edited. So, for example, if you notice an invalid value (perhaps a typo, or a missing 0) you can fix it up. Remember to export your data so you don’t have to fix it again next time! |
 | Variable View | In variable view, users are presented with a list of the variables in the dataset, along with some basic meta information about them. This includes variable types (numeric, categorical, or date-time) and a brief summary of the type of values:
Once again, the rows in this view are also draggable, so they can easily be dropped onto one of the variable slots to create a new graph. |
 | Dataset Information | The spreadsheet view provides a rectangular view of every value in your dataset. However, some datasets might have lots of rows or columns (or both!) so iNZight uses pagination. This ensures that the software can quickly load the interface, without restricting what you can see (in previous verisons of iNZight, the spreadsheet view was disable for large datasets). Use the pagination controls (columns are controlled at the top; rows at the bottom) to navigate through your dataset. Remember, you can also use the search functionality to find specific columns/variables. |
 | Search Variables | If your dataset contains lots of variables, it can be difficult to find the variable you’re looking forward. In this situation, use the search button to open the search box. This lets you filter down the variables display in both the spreadsheet and variable views. |
Pagination


The spreadsheet view provides a rectangular view of every value in your dataset. However, some datasets might have lots of rows or columns (or both!) so iNZight uses pagination. This ensures that the software can quickly load the interface, without restricting what you can see (in previous verisons of iNZight, the spreadsheet view was disable for large datasets).
Use the pagination controls (columns are controlled at the top; rows at the bottom) to navigate through your dataset. Remember, you can also use the search functionality to find specific columns/variables.