The Menu Bar
The menubar is displayed at the top of the iNZight window, and allows you to things like import data, apply transformations to your data, manipulate variables, and many other things. More advanced features are often placed in here to keep the rest of the interface as simple as possible.

File
The File menu is where you interact with files on your computer (either by importing or exporting data), as well as access example data sets and manage your preferences.

-
Import data from a file on your computer, or a remote URL.
-
Export data to a file on your computer.
-
Clipboard
- Paste from the clipboard (e.g., copy from Excel / Google Sheets)
- Copy to the clipboard and paste into e.g., Excel or Google Sheets
-
Example data lets your choose from a list of example data sets.
-
Preferences lets you change some of the settings in iNZight.
-
Reload iNZight can be useful if you run into random errors.
-
Exit closes iNZight.
Click the links above to go to the relevant reference page.
Dataset
Organise and restructure your data, specify special structures, and filter out unwanted observations.
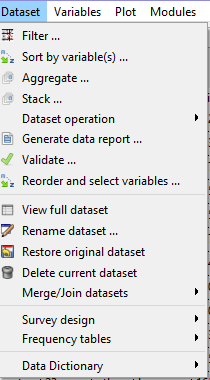
-
Filter data by numeric condition, levels of a categorical variable, by row number, or randomly.
-
Sort by variable(s) to reorder rows according the values of one or more variables.
-
Aggregate to summarise data by groups.
-
Stack to convert wide data (multiple observations per row) to long data (one observation per row).
-
Dataset operation
- Reshape dataset to convert between wide and long data.
- Separate column to split a column into multiple columns or rows.
- Unite columns to combine multiple columns into one.
-
Generate data report - Automated data quality report using dataMaid package (PDF/HTML output)
-
Validate to check for errors in your data.
-
Reorder and select variables - Change column order and select subset of variables
-
View full dataset shows the entire dataset in a pop-up window.
-
Rename allows you to rename the dataset.
-
Restore original dataset: restores the data set to the way it was when it was initially imported.
-
Delete current dataset removes the dataset from iNZight.
-
Merge/Join datasets
- Join by column values to combine two datasets by matching observations.
- Append new rows to add rows from one dataset to another with the same variables.
-
Survey design to specify the design of a survey dataset.
- Specify design
- Specify replicate design
- Post stratify or rake/calibrate
- Remove design
(Manipulate) Variables
A collection of variable manipulation methods to allow you to convert variables to new types, create new variables, and rename existing ones.
Called Manipulate Variables in iNZight Lite.

- Convert to Categorical to convert a numeric variable to categorical.
- Categorical Variables to manipulate categorical variables.
- Reorder levels to change the order of the levels of a categorical variable.
- Collapse levels to combine levels of a categorical variable.
- Rename levels to rename levels of a categorical variable.
- Combine categorical variables to combine two categorical variables into one.
- Numeric Variables to manipulate numeric variables.
- Transform to apply a transformation to a numeric variable.
- Standardise to standardise a numeric variable.
- Form class intervals to convert a numeric variable to categorical.
- Rank numeric variables to rank the values of a numeric variable.
- Convert to categorical (multiple) to convert multiple numeric variables to categorical (batch conversion).
- Dates and Times
- Convert to to convert a variable to a date or time.
- Extract from to extract information from a date or time variable.
- Aggregate to to aggregate a date or time variable to a higher level.
- Rename variables to rename variables.
- Create new variables to create new variables from existing ones.
- Missing to categorical to make missing values explicit.
- Delete variables to delete variables.
Plot
The plot menu is an alternative to the Plot Toolbar, so please check that page for functionality.

Advanced
The Advanced menu provides a suite of extra features and modules for more specialised analyses:
- Quick Explore - Tools for quickly exploring your data, including missing value analysis, all 1-variable plots/summaries, 2-variable exploration, and pairs plots.
- 3D Plot - Interactive 3D scatter plots.
- Time Series - Time series decomposition, seasonal plots, and forecasting.
- Model Fitting - Linear regression, generalized linear models, and model diagnostics.
- Multiple Response - Analysis of multiple response survey questions.
Help
The Help menu gives users quick access to information about iNZight and links to the documentation.

- About provides information about iNZight.
- User Guides provides links to main user guide pages.
- Transition Guide links to the latest transition guide to help migrating from a previous version.
- Change history jumps to the changelog.
- FAQ jumps to the FAQ site.
- Contact us or Report a Bug takes you to the contact page.