Control Panel
The control panel is the main interface for selecting variables to explore. There are four drop-down boxes: two for main plotting variables and two for subsetting.
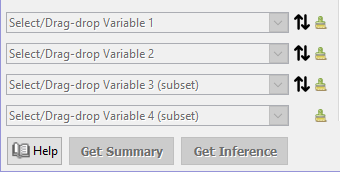
Variable 1: the primary variable of interest
The first drop-down box allows you to specify the Primary Variable of Interest. This is required for all plots.
- Main variable
- Response
- Outcome
Variable 2: secondary variable
The second drop-down box allows you to specify a secondary variable. This is optional, and will produce a new plot depending on the types of both variables 1 and 2.
- Explanatory variable
- Covariate
Variable 3: subsetting/faceting variable
The third drop-down allows you to subset, or facet, the plot. This will not affect the typo of plot displayed.
Variable 4: filtering variable
The final drop-down box allows you to filter the data. By default, no change will occur until you move the slider.
Switch: The down arrow allows you to quickly swith the variable on that row with the one below it.
Clear: The cross to the right of each drop-down clears that variable.
Get Summary
The Get Summary button opens up a new window that presents a basic statistical summary of the data in the current plot.
Get Inference
The Get Inference button opens up a new window allowing users to generate simple statistical inferences of the data, for example confidence intervals for basic statistics or hypothesis tests. The range of options available depends on the types of variables selected.