First graphs
Creating your first graph
Once the data is loaded, iNZight will display the spreadsheet in the left-hand panel of the main window, like this:
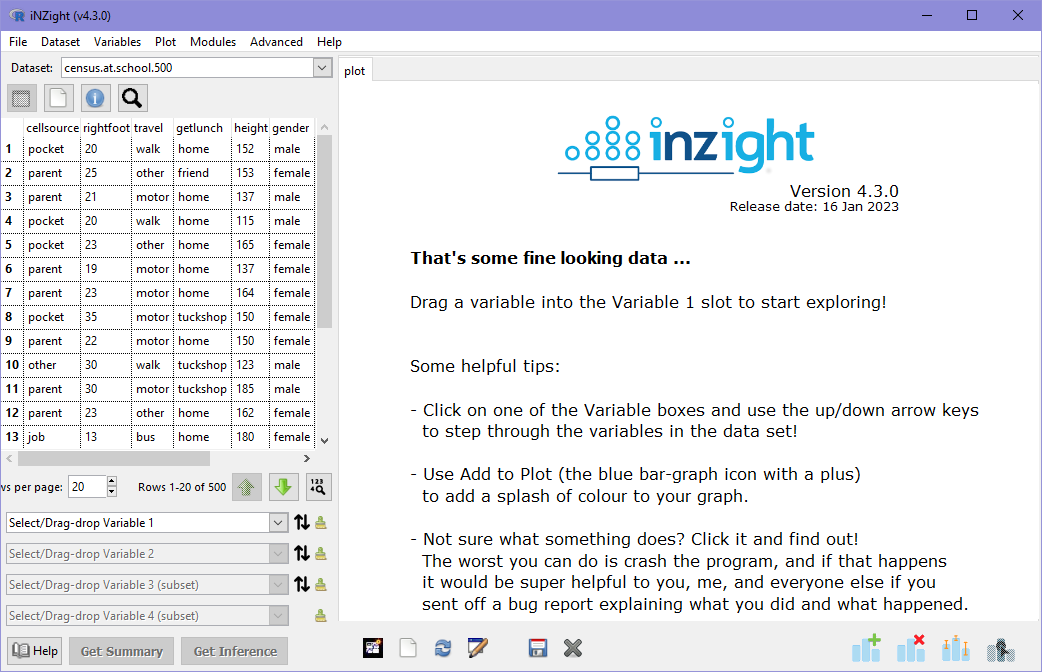
iNZight only displays a subset of rows at a time, and you can move up and down the dataset using the 'Up' and 'Down' buttons below the spreadsheet. If you want to load the full spreadsheet, Dataset > View full dataset will give you one in a new windows for you to explore.
Now you're ready to create your first graph! The variable names at the top of the spreadsheet view are draggable---go ahead and try dragging "travel" onto the Variable 1 box underneath (labeled "Select/Drag-drop Variable 1"). Congratulations---you've created a bar chart of travel, which is exactly the best way of graphing this type of categorical variable!
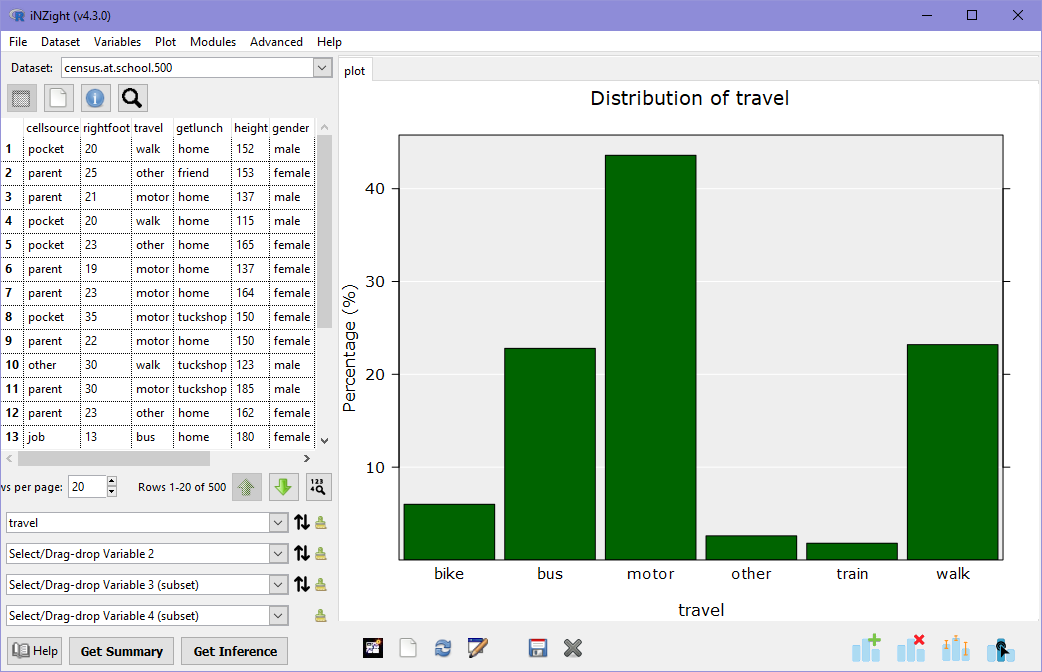
These are variables that have distinct categories, levels, or groups. In the example above, the variable travel can take values such as "bike" or "bus". These might also be referred to as factor or qualitative variables.
Another way of choosing variables is to select them directly from the Select
variable dropdown. For example, click the first variable box (currently
labeled travel) and choose height from the dropdown.
You will now see a dot plot in which all of the 500 students' heights are "dropped" onto the graph and allowed to stack if they land on top of an existing point. This is a great way of looking at numeric variables to see how the values are distributed.
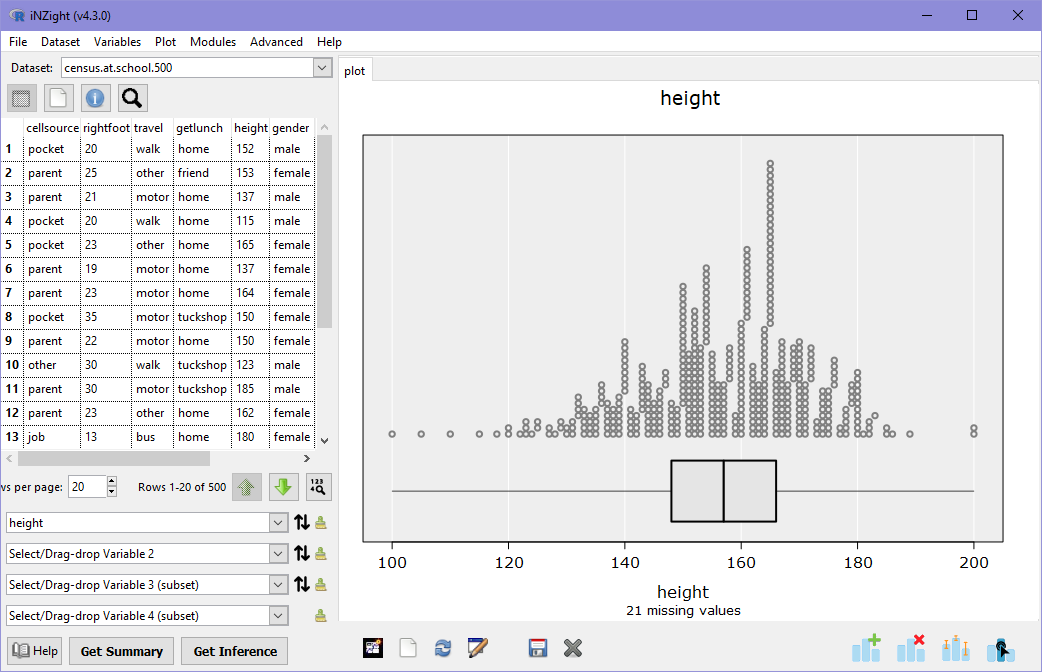
These are variables that have values which can be measured or counted. In the example above, the variable height can take any positive value as measured using a ruler. These might also be referred to as continuous or quantitative variables.
If you get confused between quantitative and qualitative variables, just remember quantitative variables are numbers!
Now it's your turn!
Create some graphs of different variables (just using Variable 1 for now) and think about what you're seeing: is the variable categorical or numeric? Can you find anything interesting? You could try answering these questions:
- What is the most popular way students in this sample get their lunch?
Hint: the variable calledgetlunchtells us where each student gets their lunch from. - Some students spend more on their monthly phone bills than others: what was the most a student spends, on average?
Hint: students monthly spends are contained in a variable calledcellcost. - What is the most common age of students in the sample?
- When it comes to mode of
travel, do more students walk to school or catch the bus (or is it too hard to tell)?