Plot Appearance
The Customise Plot Appearance options in Add to Plot provide fine-grained control over the visual properties of your plots. These settings go beyond colour, shape, and size to cover transparency, layout, and other visual details.
Transparency (alpha)

Transparency controls how see-through points are. This is especially useful for dense scatter plots where many points overlap:
- Alpha = 1 (default): Fully opaque points
- Alpha closer to 0: More transparent points, allowing overlapping regions to show as darker areas
- When transparency is applied, the point fill automatically changes from transparent to filled, so the alpha effect is visible
If your scatter plot looks like a solid blob, reducing transparency is one of the best ways to reveal density patterns. You can also try jitter or switching to a hexagonal binning plot.
Jitter
Jitter adds a small amount of random noise to point positions. This is useful when data values are rounded or discrete, causing many points to stack on top of each other:
- x: Jitter on the horizontal axis only
- y: Jitter on the vertical axis only
- xy: Jitter on both axes
Jitter does not change the underlying data — it only affects the visual positions of points on the plot.
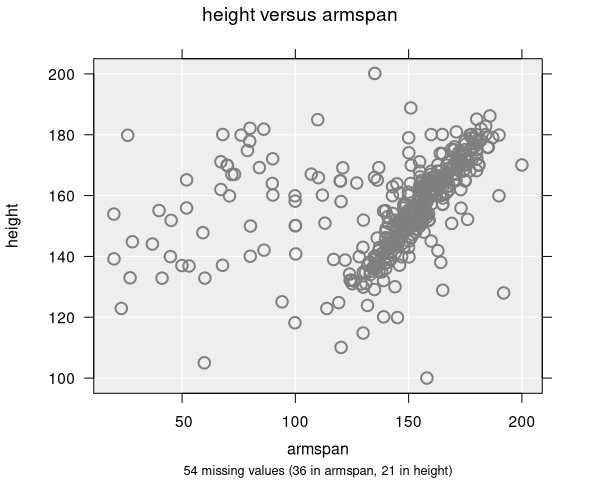
Rugs
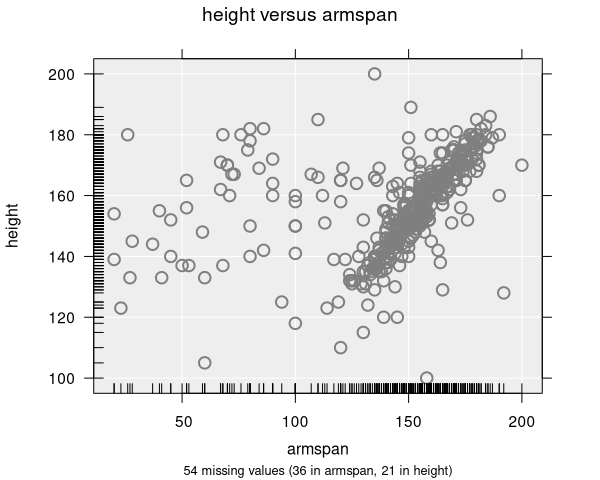
Rugs are small tick marks along the axes that show the marginal distribution of each variable individually:
- x: Show rug marks along the x-axis
- y: Show rug marks along the y-axis
- xy: Show rug marks along both axes
Rugs are helpful for seeing where observations are concentrated along each axis, even when the scatter plot itself is hard to read.
Plot type override
You can override the automatically selected plot type to switch between different visualisations of the same two numeric variables:
- Scatter plot: The standard point-by-point display
- Grid density plot: A grid density representation
- Hexagonal binning plot: A hexagonal binning representation
This is useful if iNZight has automatically selected a large-sample plot type (e.g., hex plot) but you prefer a different view, or vice versa.
Point size
The overall size of points can be scaled up or down using the point size control. This affects all points uniformly (unlike Size by variable, which scales points based on data values).
Point fill
Controls the fill colour of plotted points:
- Transparent (default): Points show only their outline colour
- Fill: Points are filled with their colour, which interacts with the transparency setting
Background colour
Changes the background colour of the plot area. The default is a light grey (#eeeeee). Grid lines automatically adjust their colour based on the background.
Grid lines
Toggle the display of grid lines in the plot area. Grid lines help with reading values but can be turned off for cleaner presentations.
Box plot (dot plots and histograms)
For dot plots and histograms, you can toggle the display of the accompanying box-and-whisker plot, which shows the median, quartiles, and potential outliers.
Applicable plot types
| Feature | Scatter | Dot | Histogram | Bar | Hex / Grid |
|---|---|---|---|---|---|
| Transparency | ✓ | ✓ | — | — | ✓ |
| Jitter | ✓ | — | — | — | — |
| Rugs | ✓ | — | — | — | — |
| Plot type override | ✓ | — | — | — | ✓ |
| Point size | ✓ | ✓ | — | — | — |
| Background colour | ✓ | ✓ | ✓ | ✓ | ✓ |
| Grid lines | ✓ | ✓ | ✓ | ✓ | ✓ |
| Box plot toggle | — | ✓ | ✓ | — | — |